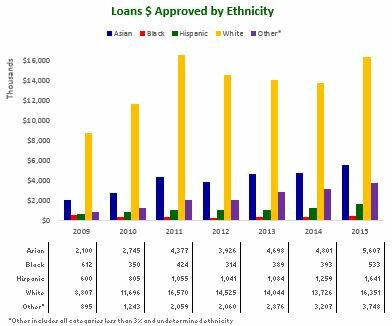
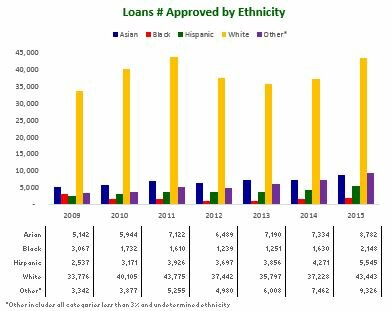
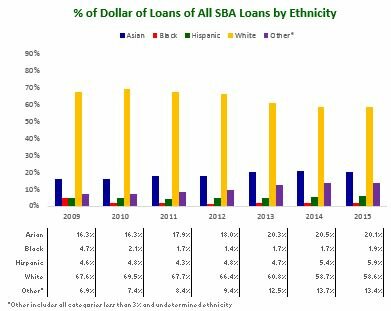
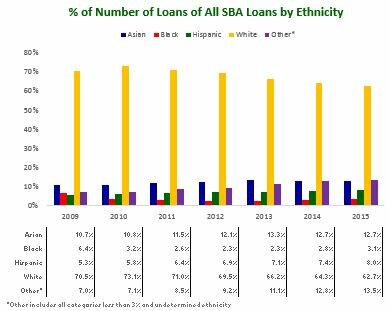
The graphs on this page offer some analytics of SBA loans approved under both the 7(a) guaranty and CDC/504 program that were identified as involving business owners who are identified by their ethnicity. These statistical results have been published by SBA back to FY 2009, and SBFI will update these statistics with graphics annually.
The various ethnic categories charted below represent the majority of statistics provided by the SBA, but certain categories were combined due to space limitations and relative low reported lending volumes in these categories. For example, ‘Hispanic’ and ‘Puerto Rican’ categories were combined into one “Hispanic” category; ‘American Indian,’ ‘Eskimo or Aleut,’ ‘Multi-Group’ and ‘Undetermined’ categories were combined into “Other.”
Loans $ Approved by Ethnic Category
The first graph illustrates the total $ volume of loans approved for the various ethnic categories through the 7(a) and CDC/504 loan programs combined, with the total level of SBA program loans highlighted with the green line.
The second graph compares the total $ volume of loans approved for the ethnic categories as a percentage of total 7(a) loans and CDC/504 loans combined.
Number of Loans Approved by Ethnic Category
The third graph illustrates the total number of loans approved for the ethnic categories through the 7(a) and CDC/504 loan programs combined, with the total level of SBA program loans highlighted with the green line.
The fourth graph compares the total number of loans approved for the ethnic categories as a percentage of total 7(a) loans and CDC/504 loans combined.
SBFI tracks a range of business lending results and lender performance through published statistics and lender surveys. Finance programs facilitated by the U.S. Small Business Administration offer several financing assistance programs to small business concerns for a variety of purposes.
For more information, contact .


