Shareholders Finally to Get Disclosure of CEO Pay

By Charles H. Green

The Securities and Exchange Commission (SEC) adopted a final rule that requires public companies to disclose the ratio of the compensation of its chief executive officer (CEO) to the median compensation of its employees. The new rule, mandated by the Dodd-Frank Act, provides companies with flexibility in calculating this pay ratio, and helps inform shareholders when voting on “say on pay.”

The new rule provides shareholders with information to evaluate a CEO’s compensation, Loan Committteeand requires disclosure of the pay ratio in registration statements, proxy and information statements, and annual reports that call for executive compensation disclosure. These disclosure rules go into effect for the first fiscal year beginning on or after Jan. 1, 2017.

Why does CEO compensation matter?

Companies get some flexibility in meeting the rule’s requirements, for example, by being permitted to select the methodology for identifying its median employee and that employee’s compensation. The rule also permits companies to make the median employee determination only once every three years and to choose a determination date within the last three months of a company’s fiscal year. The rule does not apply to smaller reporting companies, emerging growth companies, or registered investment companies.

After years of resistence, the adoption of this rule–passed 3-2 along partisan lines by the commission–is  a victory for shareholder rights advocates, who’ve been fighting for the ability of shareholders to check executive compensation. Why is that a concern for shareholders? Namely because they own the company, with some owning a larger share than the Board of Directors as a group, and most owning more interests than the CEO.

A study by the Economic Policy Institute found that from 1978 to 2013, CEO compensation, inflation-adjusted, increased 937 percent, a rise more than double stock market growth and substantially greater than the painfully slow 10.2 percent growth in a typical worker’s compensation over the same period. For all of the bellowing about “shareholder value,” the study reveals that the C-suites have provided themselves with outsized pay, grossly excessive compared to the gains delivered to company owners.

More shocking is when you consider that these statistics represent pay to the same executives who directly, or through proxies like the U.S. Chamber of Commerce, howl in opposition to any suggestion of raising minimum wages for the lowest rung employees.

Consider that the average CEO-to-worker compensation ratio was 20-to-1 in 1965, and rose to 29.9-to-1 in 1978. From there, it grew to 122.6-to-1 in 1995, and was 295.9-to-1 in 2013, far higher than it was in the 1960s, 1970s, 1980s, or 1990s Shareholders did fare nearly so well in most instances.

What are they worth?

It goes without saying that for the high price tags, much is expected of these high-flying CEOs–and they get it. A compilation of CEO pay was provided by the NYTimes last year shows that pay packages and perks challenge the imagination as to what one would do with all the loot. There’s an accompanying story trying to reconcile that value to the companies, found here.

The ugly truth is that the tenure for the average Fortune 1,000 CEO is short, and their ability to deliver true long term value to shareholders is questionable. Compensation is generally determined by a board of directors, who themselves are CEOs or clubby members who often serve on a web of multiple boards with interlocking relationships. Sometimes expectations are not met and the price to start over can be steep–such as in the case of former Home Depot CEO Robert Nardelli, who was paid over $200 million to quit after disappointing shareholders while rival Lowe’s stock price doubled.

The new rule won’t instantly change any of these factors, but it will provide more open disclosure to company owners, employees and the world about what the corporate culture really is in the C-suite. This information which will empower them to more forcefully make changes where their values are not reflected in the companies they own or work for.

And more importantly, eventually stop over-paying those disclosed to be grossly overpaid for substandard performance.

Did you know SBFI offers commercial lender training–learn more here.

Read more stories of interest to commercial lenders here.

What do you think about this story? Comment below or write me at .


Share This
Twitter LinkedIn Digg Reddit StumbleUpon  

Gallup’s Job Creation Index at All-Time High in August

By Ravinder Kapur

Gallup’s U.S. Job Creation Index is at +32, indicating that the proportion of employees across the country who think that their employers are in a hiring mode is at its highest level ever. Tracking anticipated job creation was started by Gallup in early 2008, soon after the U.S. economy entered the Great Recession.

The August U.S. Job Creation Index is based on inputs received from 17,500 employees Painteracross all 50 U.S. states and the District of Columbia. The employees, who are a mix of both permanent and temporary, are asked whether their employers plan to recruit staff, maintain it at the current level, or carry out lay-offs.

In August, while 44% of employees surveyed felt that the head-count in their firms would be increased, 12% thought that staff reductions were planned. The Job Creation Index is derived from the difference between these two percentages, and stands at +32, the highest level attained since Gallup began measuring employee perceptions on job creation.

This record level has been maintained since May, which shows that workers are of the view that employment prospects have neither improved nor deteriorated in the last four months.

The Index was at its lowest in early 2009 when it reached a level of -5, indicating that the number of employees anticipating lay-offs exceeded those who thought that their firms were planning to take on staff. Over the last six years the index has climbed steadily to reach its current level. The August survey, conducted between the first and thirty-first of the month, also had 39% of employees holding the view that their firms would neither lay off nor recruit people.

A regional break-up of employee responses reveals that job creation levels were the highest in the Midwest and lowest in the East. Additionally, hiring in the non-government sector was stronger than in the government sector.

While the Job Creation Index is at its peak, its growth seems to have tapered off with the same level being maintained for the last four months. The level of the index in the coming months will reveal whether it has paused before continuing on its uptrend or its remaining at the same level is an indication of a reversal in direction.

Share This
Twitter LinkedIn Digg Reddit StumbleUpon  

Smart Regulation for the Growing Fintech Industry

By Ravinder Kapur

Last year small businesses borrowed more than $5 billion from online lenders, making this source of finance increasingly important among the options available to them. Although this amount is a small fraction of the $300 billion exposure of domestic banks to this sector, it is expected to increase rapidly, as Morgan Stanley predicts that the fintech industry will grow 50% annually through 2020.

The rapid growth in online lending has led to several unsavory practices including difficult Money makes people go roundto understand and unconscionably high rates. A recent article in the American Banker  pointed out that some lenders originate loans in various states across the country, but issue them from Utah through a surrogate bank, and thereby avoiding the usury cap imposed by most states. Often, small business borrowers are not given complete details of the lender’s financing terms, and in many instances loan brokers are involved resulting in an increased effective cost of borrowing.

These factors indicate that there is a need for regulation of the rapidly expanding fintech industry, especially as many small business borrowers do not have the financial or legal competence to understand the true implications of the loan agreements being entered into. Online lenders catering to this segment are not governed by the Truth-in-Lending Act, with the result that borrowers can get unpleasant surprises when the terms of the loan agreement are enforced.

A report in The Conversation suggests that fintechs are in the early stages of growth, and that imposing onerous regulatory requirements developed for larger organisations may not be the best approach to take. Instead, the best way forward would be to develop a set of rules to address the main concerns arising from online lenders’ transactions with small business borrowers.

The author, Deborah Ralston, Professor of Finance at Monash University, echoes other calls for the ability of small businesses taking loans from online lenders to be provided a full disclosure of terms, including the APR, pre-payment terms and the remedies available to them against the lender, if a need for these arises. Fintechs should meet what former Treasury official Michael Barr refers to as an “objective reasonableness” test, which would require online lenders to make a reasonable attempt to explain their transactions entirely to borrowers.

Other suggestions are that fintechs should also be monitored on how they use borrowers’ personal data and not be allowed to sell it unless they have specific permission to do so. Brokers advising small business borrowers be compelled to act in the client’s best interests and disclose any conflict that may compromise their impartiality.

Online lenders offer small businesses a host of benefits which traditional banks are unable to match. Chief among these are quick turnaround times and avoiding the necessity of spending many hours collecting and submitting paper documents. The speed and level of service offered by fintech lenders translates into real savings for small business borrowers, justifying the payment of higher rates of interest.

But as Ralston advocates, when regulations are imposed on fintechs, they should serve to protect borrowers without disturbing the efficiency and business model of online lenders. This will help to strengthen the functioning of the fintechs and simultaneously benefit small business borrowers.

Share This
Twitter LinkedIn Digg Reddit StumbleUpon  

America’s Prisons–An $80 Billion Finance Issue

By Ravinder Kapur

The United States has 2.2 million people in prisons, an incarceration rate of 710 per 100,000 residents, which is more than six times the 115 global average  reported by the Organization for Economic Cooperation & Development (OECD). The annual cost incurred by prisons is a massive $80 billion, and while they may be successful at one of their stated objectives–keeping convicts locked up and away from the general population–prisons do not seem to have met their goals as correctional institutions, with about 60% of released prisoners returning within three years.

A recent report in the New York Times drew a sharp contrast between how the America Handcuffsand Germany approach the problem of incarcerating and rehabilitating criminals. The total number of prisoners in Germany is only 63,500, a figure which represents one-tenth of the American rate. In Germany each prisoner is housed in a separate cell with its own bathroom and every unit has a phone with which to call home. Prisoners have access to kitchens with fresh food purchased with wages earned doing vocational work.

Many German prisoners are allowed to leave the prison several times a year to visit family and friends. The German system also requires corrections officers to undergo a rigorous two-year training program, as opposed to the normal American training regimes of only a few months. There is a great deal of stress on rehabilitation and prison officials take this part of their duty very seriously.

The American prison system is not only unsuccessful in helping former inmates become productive members of society, it is also very expensive to maintain. A Washington Post article reveals that the cost of a prisoner in the general population is $27,549 a year, while older prisoners who require medical treatment and expensive prescription drugs can cost the government $58,956 each.

Referring to the enormous and wasteful costs incurred by American prisons, President Obama tweeted, “We could eliminate tuition at every public college and university in America with the $80 billion we spend each year on incarcerations,” and “Mass incarceration doesn’t work. Let’s build communities that give kids a shot at success and prisons that prepare people for a 2nd chance.”

In fact, the cost of the prison system at $80 billion is a fraction of the total cost of $261 billion for police protection, legal services, and the judicial system. If summed up, the country’s loss caused by preventing working-age people from participating in economic activity would be even higher. President Obama’s visit to a federal prison is finally beginning to direct attention to an issue that deserves reform, and it could be the first step towards much-needed improvement in America’s criminal justice system.

Share This
Twitter LinkedIn Digg Reddit StumbleUpon  

Oil: Part of the Ongoing Adaptive Economy

By Charles H. Green

According to economist Robert Dye, America is in a “transitional economy” with considerable crosscurrents and volatility, which is leading us through an ongoing, rapid evolution, highlighted with the requirement of several complex adaptations by its participants. While he related his outlook to the global economy with many of these disruptive elements, such as technology, labor, housing and financial, I’ll focus on only one of the most dominant elements discussed: oil.

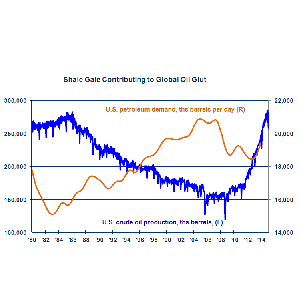
Dye is Senior Vice President and Chief Economist at ComericA Bank, and he spoke before U.S. Oil Production & Consumption, Monthly Dataan audience gathered for the third quarter economic forecast presented by the Robinson College of Business at Georgia State University recently.

Click here for a full-size copy of the nearly image, courtesy of ComericA Bank.

Why would a bank economist know anything about oil? Maybe it’s because this Dallas TX-based economist works for a bank that makes its footprint primarily in five states: Texas, California, Florida, Michigan and Arizona, which represents 31% of the U.S. GDP. And these five states include two of the top four oil producing states (TX #1, CA #4), the top three oil consuming states (TX, CA & FL), and the top auto manufacturing state (MI). Needless to say, they better understand oil.

Dye described the fast changing oil horizon predicated off of recent technological advances (extracting oil from shale), to the geopolitical theater (our old friend, Saudi Arabia). He described the rush of oil production in the U.S. as this new technology emerged as the ‘shale-gale,’ which had most economists predicting the return of a booming manufacturing sector in the U.S., such as we described one such viewpoint last September. That month, the average price of West Texas Intermediate crude oil sold for $92.58/barrel. This week that same oil is selling for less than one-half the price.

Who would have imagined just ten years ago that the ‘shale gale is contributing to the global oil glut? And if the U.S. and other five leading nations enter into an agreement with Iran regarding their nuclear power development, count on another 1 million barrels of oil headed to the market each day.

It’s notable that Saudi Arabia has responded to both the rise in U.S. oil production and falling prices with their spigot wide open. They’re charging hard to maintain global market share at any costs and replace the lost American exports with buyers in new markets. If history provides any guidance, they can manage that just fine, based on the decades they sold oil well south of $50/barrel.

Dye predicts that the days of $90-$100 oil may be over, which may greatly affect how much capital is deployed to exploring new wells in the U.S. While pricing bouncing between $50 to $60/barrel is workable, $40/barrel is different. Banking regulators have already set their sights on lending to this industry, cautioning lenders about the industry’s substandard condition that’s in the near term.

Long term depressed pricing will render U.S. oil producers as essentially the ‘swing market producers,’ meaning that they’ll kick in when shortages arise, but will fade away as production expands elsewhere. Our industry here likely will be required to adapt to switching online/ offline quickly in response to changes in the global supply, with a new goal changing from stabilizing prices to stabilizing revenues.

Oh yea, and all the talk about re-shoring our manufacturing base due to lower energy costs? Those rosy predictions are starting to abate as falling U.S. oil production will dent that potential, and the remainder of opportunity may be sapped up with the rising dollar on global currency markets.

Did you know SBFI offers commercial lender training–learn more here.

Read more stories of interest to commercial lenders here.

What do you think about this story? Comment below or write me at .

Share This
Twitter LinkedIn Digg Reddit StumbleUpon  

Algorithms Can be Discriminatory

By Ravinder Kapur

One would expect that decisions made by algorithms would be bias-free and non-discriminatory, as they’re based on data and not on the subjective reasoning utilized by humans. But it seems that this is not entirely true. Cynthia Dwork, a computer scientist at Microsoft Research in Silicon Valley and on expert on the issue, told the New York Times that algorithms do not automatically eliminate bias and may, in fact, perpetuate it.

In a recent study conducted at Carnegie Mellon University, it was found that Google’s data discriminationadvertising system displayed an advertisement for a career coaching service for “$200k+’ executive jobs to men more frequently than to women. Referring to the prejudice that could be inherent in such results, Dwork says, “The paper is very thought-provoking. The examples described in the paper raise questions about how things are done in practice.”

“I am currently collaborating with the authors and others to consider the differing legal implications of several ways in which an advertising system could give rise to these behaviors. It may be that there is more competition to advertise to women, and the ad was being outbid when the web surfer was female.”

The Federal Trade Commission has also been raising the issue of using data to discriminate against low-income and minority groups. It has quoted research studies to show that demographics can influence predictive advertisements that show up on Google AdWords.

The FTC has found that data brokers categorized consumers based on categories like “ethnic second-city struggler” and “urban scrambler ethnicity,” and this information was used to offer high-interest payday loans and other high-interest loans that could lead to further economic distress for these borrowers.

In the face of growing evidence that algorithms and other software can discriminate because of the prejudices of the programmer or the nature of historical data, there is a need to develop techniques to counter this. One possible solution is that companies using algorithms regularly run simulations to test whether the program is performing in the way they would want it to and if it would stand up to scrutiny.

Share This
Twitter LinkedIn Digg Reddit StumbleUpon  

Global Growth is Moving Sideways

By Charles H. Green

According to economist Gregory Daco, the global growth outlook over the next five years seems to be moving sideways, “stuck in second gear,” as he put it. With contrasting results predicted for China, the Eurozone, and the other emerging markets, along with the effects of major structural changes occurring in China and Japan, there should be growth ahead, but he predicts it will be at a muted pace.

Daco is Head of U.S. Macroeconomics at the Oxford Economics, and spoke before an China Investment in Fixed Assetsaudience gathered for the third quarter economic forecast presented by the Robinson College of Business at Georgia State University recently. He summarized the cloudy growth forecast in terms of the combination of mixed results from several of the world’s major economies:
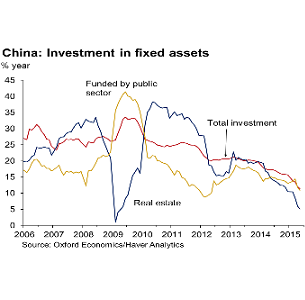
China–GDP results in China have been lower than expected, and as such, most economists have lowered forecasts, reckoning to a ‘new normal.’ Much of globe came to expect a continuation of the meteoric growth levels in the 10 to 12 percent range experienced in recent years, but that level has tapered off quickly without explanation. And given China’s tendency to obfuscate their intentions, there is global recognition that the economy is slowing down faster than the official numbers are described by the government.

Complicating matters is the fact that there are political transitions in play, with President Hu Jintao in the midst of purging the vast government of hundreds of senior and mid-level bureaucrats in an effort to root out corruption, all the while struggling with a slowing economy, which is not known as his strongest suit. There are emerging changes in upper mobility of Chinese consumers, who were encouraged to borrow for investments, only to watch the Shanghai composite index drop off precipitously in recent months.

After five years worth of building inventory and in the middle of a huge infrastructure building program, suddenly China’s commodity purchases has dramatically dropped off, leading to falling prices and activity. The question of not whether growth will slow, but how fast and how far?

So how are the other BRIC nations faring, in light of China’s stumble? There again, results are mixed, with two of the three suffering the hangover effects from Chinese gyrations.

Brazil-This emerging economy, darling of the late 2000s, hit the end of their super- growth rather abruptly. When China started buying up commodities in the 2000s, Brazil aimed an outsized portion of their output in response, and today is feeling the pain of those purchases going away. The commodity spikes are over, so production has slowed in response, unemployment has climbed back to high levels and there’s less capital available to support growth for anything else. Brazil is stuck with high debt levels, but their monetary policy is tough to effect any relief with a softening currency. A recession is forecast in 2016.

Russia –Despite a strong economy in recent years driven by the strong global demand for its oil and gas, Russia is not faring so well as oil prices have plummeted and the international economic sanctions over its invasion into Ukraine have begun to take a toll. Russia’s dependence on oil revenues has left it high and dry, as its currency has fallen off badly over the last year.

India-Of the BRIC countries, India is the bright spot at this time. Their emphasis on  education development and investments are admirable for the long term potential for growth. Their more pro-business government is making key investments in transportation and food production, which have both brought prices down and given consumers more income. Prospects for this economy are looking positive.

Japan-Elsewhere, the world’s third largest economy is not projected to fare much better than recent years, but if there is a glimmer of positive news, they’re not projected to be heading into a recession, based on second quarter growth. Japan has an aging population, and although consumer confidence remains “ok,” wage growth has been flat or falling over the last several years, as workers have little bargaining power.

Industrial production growing is growing, but household spending is volatile. A 2014 planned tax hike cooled spending considerably last year, and after it went into effect, buying plunged. Inflation is hovering on deflation.

Europe-The big question for Europe is whether growth there, driven by considerable reductions in oil prices, is sustainable? Leading indicators suggests there is better growth ahead, and momentum is leaning toward solid gains in consumer growth and employment growth. Even consumer confidence is looking upward.

Will this be followed by corporate investments and profits? The Euro’s weakness tends to add inflationary pressure, meaning some consumers may postpone spending, and certainly lower spending on imports. Greece remains a risk, but is currently a much lower risk since the crisis has been deferred to work out down the road.

And where does the U.S. fit into this equation. Although we had a slow start to 2015, there was a stronger than expected 2nd quarter, particular in western states. Growth expectations remain strong for the balance of the year along with employment gains. The only question is when–not whether–the Federal Reserve will begin to normalize interest rates.

Did you know SBFI offers commercial lender training–learn more here.

Read more stories of interest to commercial lenders here.

What do you think about this story? Comment below or write me at .

Share This
Twitter LinkedIn Digg Reddit StumbleUpon  

EDF Resource Capital Settles SBA Claims

By Charles H. Green

The U.S. Justice Department announced Friday that EDF Resource Capital Inc. and its CEO, Frank Dinsmore, have agreed to resolve allegations that they violated the False Claims Act and otherwise failed to remit payments owed to the Small Business Administration (SBA) under the 504 loan program.  Under the settlement agreement, EDF and Dinsmore have agreed to make payments and turn over certain assets to the United States for a total settlement of approximately $6 million.

The settlements were the result of a coordinated effort by the Civil Division’s Commercial

Frank Dinsmore - photo courtesy of Biz Journals

Frank Dinsmore – photo courtesy of Biz Journals

Litigation Branch, the SBA’s Office of General Counsel and the SBA’s Office of Inspector General Los Angeles Field Office’s Counsel Division and Investigations Division. More background on this story is available through a series of articles by BizJournals here, chronicling the fall of the former second largest producer of SBA 504 debentures in the nation.

The SBA in 2012 said it seized EDF Resource Capital because it was owed nearly $15 million — its share of the loss on $99 million in loans the SBA had charged off.

Dinsmore’s attorney blasted the settlement to a reporter for the Sacramento Business Journal as “horribly misleading.” “The government shut this company down, and the government consistently denied the ability for the company to pay its employees,” said Andrew Sackheim, a partner with the Real Estate Law Group LLP in Sacramento. The company had 65 employees when the government shut it down in 2012.

Dinsmore was accused of failing to pay monies over to the SBA as EDF Resource’s share of loan losses occurred that were approved originally under the Premier Certified Lender Program (PCLP), a designation for a Certified Development Company (CDC) similar to the Preferred Lender Program (PLP) under the SBA 7(a) loan guarantee program. Under PCLP, CDCs are delegated authority to approve, close and liquidate 504 debentures in return for meeting certain conditions and accepting liability for a portion of any resulting loan losses.

The government accused Dinsmore of not making payments that were due on loan losses between 2009-2012, maintaining insufficient reserves for potential future losses, and hiding accumulating loan problems that were mounting.

Did you know SBFI offers commercial lender training–learn more here.

Read more stories of interest to commercial lenders here.

What do you think about this story? Comment below or write me at .

Share This
Twitter LinkedIn Digg Reddit StumbleUpon  

Do Stock Buybacks Deter Economic Growth?

By Ravinder Kapur

Recently, Hillary Clinton asserted that the sum money that public companies are pouring into stock buybacks has resulted in drastically lower amounts being allocated towards new capital investment, research, worker training and wage increases. In other words, the share retirement has come at an economic expense of not expanding growth and building factories, but rather only offering liquidity to investors who could have found other buyers, if needed.

How much are we talking about? Would you believe a colossal $7 trillion has been spent Business Loansby companies on stock buybacks since 2004, a sum equal to 54% of all profits from Standard and Poor’s 500-stock index companies between 2003 and 2012. That doesn’t sound like capitalism in action.

The New York Times reported that Clinton favors amending security regulations regarding stock buyback activities to bring them to par with rules similarly found in the United Kingdom and Hong Kong, where such deals are required to be disclosed within a day. Currently, U.S. companies can wait an entire quarter before having to report stock buyback transactions.

Meanwhile, Senator Elizabeth Warren and Senator Tammy Baldwin view this degree of buybacks as a possible attempt to manipulate the market, and have asked the Securities and Exchange Commission (SEC) to take a closer look into this aspect of these transactions. Share buybacks usually result in an increase in corporate earnings per share (EPS), a measure used by many companies to determine executive compensation.

Buybacks may also result in a temporary spike in share prices, creating an opportunity for inside executives to sell their shares at inflated values for a certain profit. Another drawback of a company purchasing its own shares is that the transaction might be done at a time when prices are high. In certain cases, some companies even borrow money to finance share buybacks, a practice fraught with risks.

Renowned investor Warren Buffet, Chairman of Berkshire Hathaway, is generally a supporter of share buybacks, but he does so on a qualified basis. “I favor repurchases when two conditions are met: First, a company has ample funds to take care of the operational and liquidity needs of its business; second, its stock is selling at a material discount to the company’s intrinsic value, conservatively calculated. We have witnessed many bouts of repurchasing that failed our second test.”

While the link between economic growth and share buybacks may be tenuous, the fact that over half of corporate profits in the last decade have been utilized for this purpose certainly needs to be analyzed. The popularity of buybacks may indicate that companies are not confident of earning an adequate return on investment and hence prefer to pay this amount to shareholders.

Share This
Twitter LinkedIn Digg Reddit StumbleUpon  

Consumer Demand + Investment Trumps Market Turbulence

By Charles H. Green

With China’s economy stalled as Europe growth is limping, U.S. GDP growth in coming months ahead will be predicated on the return of healthy domestic consumer demand and more capital investment, despite recent stock market turmoil, says Rajeev Dhawan of the Economic Forecasting Center (EFC) at Georgia State University’s J. Mack Robinson College of Business.

Dhawan’s assertions were delivered in his quarterly “Forecast of the Nation,” released Rajeev DhawanThursday, against the backdrop of China’s currency devaluation in mid-August. Even though initial reactions were negative, he characterizes the devaluation as “positive news for the economy overall,” which will boost domestic profit margins on imported goods.

Between low gas prices and wealth gains from reflated home prices and stock portfolios, post-recession consumers are in the mood to spend, albeit judiciously, on utility items. For the first seven months of the year, vehicle sales averaged 17.0 million units – up 4.5% over the previous year’s strong sales numbers, led by light trucks that drove the increase, rising by 10.7% over the previous year. By contrast, consumers hit the brakes when it came to passenger car purchases, which declined 1.9%.

As for oil, Dhawan anticipates prices will stay below $60/barrel until late 2016 due to a drop in global demand and an increase in drilling efficiency by U.S. producers. “People can safely expect low gas prices to continue for the next year.”

But when will the Federal Reserve determine that the economy is strong enough to hike interest rates and by how much? “The expected rebound in investment spending (forecast to rise 6.2% in the second half of 2015), will be strong enough for the Fed to start normalizing interest rates,” Dhawan said. “The issue is whether it will do so at the September or December meeting.” At present, remarks by key officials strongly telegraph a September move provided the ongoing market correction doesn’t deepen further.

Highlights from EFC’s National Report:

  • After stumbling in the first quarter of 2015, real GDP grew strongly at 2.3% in the second quarter. Growth of 2.2% is expected for the second half of the year, which will lead to an overall annual rate of 2.2%.
  • Business investment growth will hit 3.0% in 2015, rebound to 5.4% in 2016 and 5.2% in 2017. Jobs will follow by a monthly rate of 219,000 in 2015, 226,000 in 2016 and 214,000 in 2017.
  • Housing starts will average 1.105 million units in 2015, rise to 1.202 in 2016 and 1.275 in 2017. Expect auto sales of 17.0 million units in 2015, 16.5 in 2016 and 16.4 in 2017.
  • The 10-year bond rate will rise to 2.7% in 2015 and should rise to 3.3% before the end of 2017.

Did you know SBFI offers commercial lender training–learn more here.

Read more stories of interest to commercial lenders here.

What do you think about this story? Comment below or write me at .

Share This
Twitter LinkedIn Digg Reddit StumbleUpon